




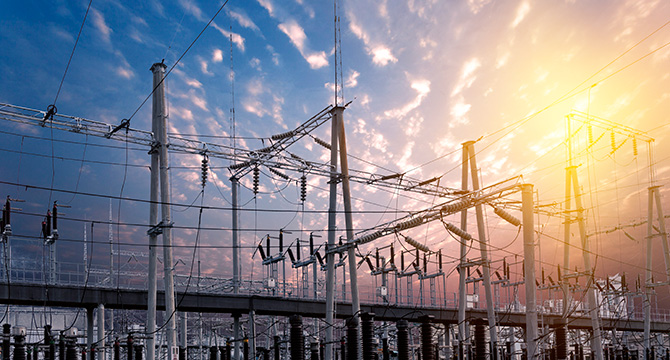
America’s investor-owned electric utilities have committed historic amounts of capital to expanding and modernizing the power system. The Edison Electric Institute projected that its member companies would invest nearly $208 billion in 2025, compared with approximately $139.8 billion in 2020, an increase of nearly 49 percent. EEI also projected more than $1.1 trillion of industry capital expenditures during 2025 through 2029.
The capital commitments are substantial. The increasingly immediate question is whether utilities can procure and install the equipment those plans require on schedule.
Transformers, conductor, breakers, switchgear, and substation equipment have become critical scheduling constraints. CoBank’s July 2026 review of the sector found that demand for critical materials has outstripped supply, contributing to longer lead times, rising costs, raw-material scarcity, and continuing labor shortages. Equipment that once could be obtained in less than a year has, in some cases, carried lead times of three or four years. That strain reflects the scale of new demand hitting the supply base at once, not a failure by any one link in the chain.
Inflation is adding to the pressure. CoBank reported that the headline Producer Price Index was 6.5 percent higher year over year in May 2026. It separately found that, since 2020, inflation in key utility components had outpaced both the broader PPI and the Consumer Price Index. That does not mean every piece of grid equipment increased 6.5 percent during the preceding year; it means utilities are procuring equipment in an inflationary environment in which several of their most important inputs have experienced particularly sustained cost pressure.
Transformers Are the Clearest Example
Industry publications reporting on Wood Mackenzie’s second-quarter 2025 transformer survey said lead times for power transformers averaged 128 weeks, or nearly two and a half years. Generator step-up transformers averaged 144 weeks. These units connect generation facilities to the transmission system and are among the largest and most specialized pieces of equipment in the power sector.
The same Wood Mackenzie data, as reported by industry publications, showed that power-transformer prices had increased approximately 77 percent since 2019. Demand for generator step-up transformers had grown 274 percent over the same period, while overall power-transformer demand had increased 119 percent. Wood Mackenzie estimated a 2025 U.S. supply deficit of approximately 30 percent for power transformers and 10 percent for distribution transformers.
Materials are an important part of that constraint. Conventional transformer cores require grain-oriented electrical steel, commonly called GOES, while their windings require substantial quantities of copper. Cleveland-Cliffs is the only domestic producer of GOES, leaving U.S. transformer manufacturers dependent on one domestic source as well as imported material.
Not every transformer order will take more than two years. Lead times vary by manufacturer, size, voltage class, specifications, and order volume. But equipment procurement can determine when a project is energized, even when the utility has approved the project and secured the necessary capital.
Where the Money Is Landing
Distribution infrastructure has been the largest source of growth in utility capital spending over the last two decades. According to the U.S. Energy Information Administration, distribution capital investment increased by $31.4 billion, or 160 percent, between 2003 and 2023. More than one-fifth of that increase occurred between 2022 and 2023, when distribution spending rose by $6.5 billion to $50.9 billion.
Investment in line transformers reached $7.5 billion in 2023, an increase of 23 percent from 2022. EIA attributed the increase in part to supply-chain and manufacturing constraints affecting the electric-power industry generally, a pattern consistent across the sector rather than a problem specific to any single supplier. Utilities also spent $6.1 billion on distribution-substation equipment in 2023, an increase of 15 percent from 2022 and 184 percent from 2003.
Transmission spending nearly tripled between 2003 and 2023, reaching $27.7 billion. More recent EEI industry data report that investor-owned electric companies spent $30 billion on transmission investment in 2023 and $32.6 billion in 2024. EEI projected $39.9 billion for 2025 and approximately $178 billion of transmission construction investment during 2025 through 2028.
Distribution nevertheless remains the largest individual capital-spending category. CoBank reported that utilities spent $104 billion on distribution in 2025 and that 87 percent of those expenditures went to four categories: poles and fixtures, conductors, transformers, and station equipment. Those are the categories most exposed to manufacturing capacity, material availability, inventory, and logistics decisions.
Distribution also differs from many large generation or transmission projects simply because of how many components are involved. Distribution programs require equipment to be procured and installed repeatedly across thousands of locations. That volume and fragmentation can place continuous pressure on supplier capacity even when no single project appears extraordinary.
Why Demand Got Ahead of Supply
Data centers and other large industrial loads are major incremental sources of electricity demand, but they are not the only drivers of utility investment.
Utilities are simultaneously replacing aging infrastructure, hardening systems against extreme weather, connecting new generation, accommodating distributed-energy resources, modernizing control systems, and responding to electrification. CoBank identifies rising load growth, grid hardening, aging-infrastructure replacement, and system modernization as the principal drivers behind the current investment cycle.
Data centers intensify those existing pressures because their loads can be unusually large and concentrated. New generation needed to serve those facilities may require additional transmission capacity. The facilities themselves also require substations, transformers, switchgear, distribution connections, and backup-power systems. The result is simultaneous demand across multiple equipment categories rather than isolated pressure on one part of the grid.
S&P Global’s Regulatory Research Associates projected approximately $1.295 trillion of utility capital expenditures during 2026 through 2030, up from a $1.169 trillion forecast the firm made in December 2025. That upward revision in just four months underscores how quickly utility capital plans and project costs are changing. It does not necessarily mean that the physical quantity of needed equipment was underestimated by the same amount, because capex forecasts can also be affected by equipment inflation, construction costs, revised generation plans, and changes in individual utility budgets.
Manufacturers Are Investing Heavily to Catch Up
Equipment manufacturers have moved aggressively to add North American production capacity, and the scale of that commitment is significant. Since 2023, manufacturers have committed nearly $2 billion in total to new or expanded transformer capacity, according to industry reporting. Eaton committed $340 million in February 2025 to convert a Jonesville, South Carolina site into its third U.S. three-phase transformer plant, part of more than $1 billion the company has put into North American manufacturing since 2023. Siemens Energy is building its first U.S. large power transformer plant in Charlotte, North Carolina, a $150 million facility expected to begin production in early 2027 and eventually produce 57 units a year at full capacity. Hitachi Energy has committed more than $1 billion across multiple sites, including a $457 million facility in South Boston, Virginia, set to become the nation’s largest large power transformer plant by 2028, and a $106 million expansion in Alamo, Tennessee.
Roughly $2 billion in new manufacturing investment in three years is a large, fast response. It just can’t outrun physics. A new transformer plant takes years to build, staff, and qualify for production, no matter how much capital goes in on day one. The gap between demand and available capacity comes from how fast electricity demand accelerated and how long a factory takes to stand up, not from anything the manufacturers did wrong.
Other electrical equipment makers are expanding in parallel. Terrapin Construction Group, a national contractor, reports current procurement ranges of 52 to 80 weeks for medium-voltage switchgear and 40 to 65 weeks for pad-mount distribution transformers, ranges based on the company’s active 2026 manufacturer-slot reservations and project-procurement data rather than a comprehensive national survey. Actual delivery times vary by manufacturer, voltage class, specifications, quantity, and project, but the broader pattern holds: demand is being met with real, substantial new investment across the supply base, even as that investment takes time to fully translate into shorter lead times.
What This Means If You Supply the Grid
For manufacturers of cable, conductor, transformers, switchgear, and substation components, the central story is not simply the size of one year’s capital budget. It is the expected duration of the investment cycle.
EEI’s five-year projection and S&P Global’s separate 2026 through 2030 forecast both point toward sustained utility capital spending rather than a temporary bulge associated with a handful of projects. Aging infrastructure, reliability investment, industrial development, data-center construction, new generation, and growing electricity demand are operating at the same time.
That environment can favor suppliers by creating visibility into future demand, but it also exposes them to risk. A manufacturer entering a multiyear supply agreement must determine how much production capacity to reserve, how far in advance to purchase material, and how to allocate the risk of changes in copper, steel, labor, transportation, tariffs, and energy costs.
Utilities and their contractors face the other side of the same problem. They want dependable capacity, predictable pricing, and enforceable delivery schedules, but they may be placing orders years before a project enters service.
Long-term supply agreements should therefore treat current pricing and delivery conditions as a snapshot of a changing market rather than a permanent baseline. Depending on the product and relationship, relevant provisions may include price-adjustment mechanisms tied to defined cost inputs, volume bands, rolling forecasts, capacity-reservation obligations, allocation rights during shortages, delivery windows, change-order procedures, and remedies for delay.
The appropriate allocation will differ by transaction. What matters is recognizing that a contract designed for a single project in a stable procurement environment may not adequately address a multiyear utility program in a constrained market.
Rate Cases Decide Whether Any of This Actually Gets Spent
Capital can be committed before final rate approval, but regulated utilities generally depend on being permitted to place prudent investment into rate base or recover it through rate cases, formula rates, riders, trackers, or comparable mechanisms.
Under traditional cost-of-service regulation, regulators determine a utility’s revenue requirement, including recovery of reasonable operating expenses and a return on qualifying investment devoted to providing utility service. Not all expenditures are automatically recoverable, and the timing and method of recovery differ by jurisdiction and type of investment.
That distinction matters. A utility may proceed with construction before the relevant regulatory process is complete, but an adverse outcome can delay cost recovery, reduce the expected return, or cause the utility to defer or resize future capital programs. Transmission investment may also be subject to federal or regional rate mechanisms rather than only a state general-rate proceeding.
For that reason, national capex projections should not be treated as guaranteed spending. State commission decisions, FERC-regulated rate mechanisms, customer-affordability pressures, financing costs, and project-specific approvals will influence how much projected capital is ultimately deployed and when.
The national figures describe the size of the opportunity. Regulatory activity determines whether particular programs remain economically sustainable.
The Bottom Line
The United States does not lack utility capital plans. It faces the harder operational task of converting those plans into functioning infrastructure.
Capital budgets are at record levels, but procurement capacity, equipment lead times, skilled labor, and material availability are increasingly determining how quickly those budgets can become operating assets. Money remains important, as do permitting, interconnection, construction, and regulatory approval. But for many projects, the immediate limiting factor is whether the necessary equipment can be manufactured and delivered when the construction schedule requires it.
For companies that supply the grid, that is the opportunity and the risk. The demand appears durable. The contractual, operational, and investment decisions required to meet it will need to account for a supply chain that may remain constrained for years rather than months.